

Performance implications of Pistorius advantages
Pistorius Part IV: The performance implications complete the picture
I was going to delay this analysis until after the IAAF World Champs, which got underway this morning with a dominant Kenyan display in the women's marathon. Later today sees the women's 10,000m, and there's every chance that Kenya will have claimed the first four (or maybe even more) of the medals at this year's Championships, with Vivian Cheruiyot the favorite for gold. Ethiopia will again have something to say about this, so that should be a great race.
But then I made the "error" of posting a Tweet about Pistorius' race times,which I believe are very significant and complete the picture of the advantage, and it started something of a debate, because I think people misunderstood what I meant by performance comparisons. So I felt it necessary to post this, Part 4 of the Pistorius series, now, rather than delaying it until after the World Championships. I must make the point that the first three posts in this series explain the scientific evidence. They are the basis for the advantage, NOT this post. This post is merely to contextualize and to explain an observation about performance that further consolidates the picture, not to bring evidence to the debate. It's a small piece of the puzzle, but it fits in at the end of the three-part debate we've been having. By itself, it's not proof, but when you look at the whole picture, it is in place.
The whole picture - a recap to begin with
The missing piece in the debate so far is the performance implications of those metabolic and mechanical advantages. It's really important to keep the WHOLE PICTURE in mind as you consider this question - each line of evidence by itself is important and telling, but when the pieces come together, only then you do see the full evidence for the advantage. And the one piece that I've yet to tackle is performance. To recap, this is the picture so far:


But the picture crystalizes when you look at pacing and how the race is put together.
 I've already showed Michael Johnson's performance - a 43.18s which was made up of a 21.22 and a 21.96s. To the left is a figure showing the performance of each half compared to MJ's best, as well as a "conservative" assumption that he might have "only" run 19.8s in 1999.

Pistorius case

In the figure above, it doesn't matter much which comparison you choose, there are some enormous differences between Pistorius and able-bodied runners, and they all suggest an advantage in terms of the relative pace that he runs a 400m race at compared to his 200m race. And to repeat, this includes any time lost at the start. For comparison, here is Pistorius compared to other able-bodied athletes:

Ross
Appendix: Performance analysis - key to make the prudent assumptions
I foresee some comments about the idea about making assumptions. It was the same when I tried to explain how performance analysis can help identify and explain possible doping behaviour. So the first response is to emphasize that I'm not making these assumptions to PROVE a point, but rather to add to an already existing set of findings. The evidence is there already. I do the post above because it gives context to the evidence, a practical illustration of what the evidence suggests might be the case. To me, it adds another "brick in the wall" in the issue of Pistorius' advantage, but it's not proof, and please recognize this before labeling as absurd any of the estimates.
But more than this, I'm a big believer in performance analysis, as regular readers will know. I believe that if you are SENSIBLE about how you analyze performance, you can glean enormous quantities of useful information.
The key is that you have to be prudent about what you assume. Before dismissing an illustration based on assumption as flawed, just remember that assumption is often valuable in evaluating options. For example, in business, you always develop business cases based on assumption before making business decisions. You make a "best case" and "worst case" scenario, and if the "worst case scenario" still succeeds, then the business will likely succeed. I used to do this all the time when I worked in sports business because for example you have work out if a sports event is viable. So you assume how many tickets you'll sell, what the costs of staging the event are, and so on. If you make all the worst assumptions, and succeed, then the event works. And that's the principle here - reasonable assumptions show what is feasible and what is not.
In the Pistorius debate, Peter Weyand tried to quantify the size of Pistorius' advantage by adjusting his mechanical advantages and making them equal to those of able-bodied athletes. The result was his estimate of a 12 seconds advantage, which is probably an over-estimate.
But the point I made the other day is that it was the assumptions that may be incorrect, not the principle, and the same goes for any performance analysis. So above, I have tried to make the equivalent of "worst case" scenarios. Don't just make Pistorius equal to the "typical" case, because clearly he is not. Rather make him the outlier and see what happens then. So don't give him the 47.8%-52.2% split which is typical, show the 49%-51% and the 50-50 splits as well. Reduce the 200m time to see how it affects the pace. And when those are all done, then you start to see the picture.
There are perhaps 10 assumptions you can make - if you make all 10 in the "favourable" direction, then you find that Pistorius is getting an advantage of around 15 to 18% (7 to 8 seconds in a 400m). If you make all 10 in the "unfavourable" direction, then you can estimate the advantage at around 3 to 4% (about 2 seconds). The reality is that it's likely to be a moderate version. But the advantage is still there.
I was going to delay this analysis until after the IAAF World Champs, which got underway this morning with a dominant Kenyan display in the women's marathon. Later today sees the women's 10,000m, and there's every chance that Kenya will have claimed the first four (or maybe even more) of the medals at this year's Championships, with Vivian Cheruiyot the favorite for gold. Ethiopia will again have something to say about this, so that should be a great race.
But then I made the "error" of posting a Tweet about Pistorius' race times,which I believe are very significant and complete the picture of the advantage, and it started something of a debate, because I think people misunderstood what I meant by performance comparisons. So I felt it necessary to post this, Part 4 of the Pistorius series, now, rather than delaying it until after the World Championships. I must make the point that the first three posts in this series explain the scientific evidence. They are the basis for the advantage, NOT this post. This post is merely to contextualize and to explain an observation about performance that further consolidates the picture, not to bring evidence to the debate. It's a small piece of the puzzle, but it fits in at the end of the three-part debate we've been having. By itself, it's not proof, but when you look at the whole picture, it is in place.
The whole picture - a recap to begin with
The missing piece in the debate so far is the performance implications of those metabolic and mechanical advantages. It's really important to keep the WHOLE PICTURE in mind as you consider this question - each line of evidence by itself is important and telling, but when the pieces come together, only then you do see the full evidence for the advantage. And the one piece that I've yet to tackle is performance. To recap, this is the picture so far:
- The theory that Pistorius has an advantage is a result of two factors. First, the significant reduction in mass of the carbon fiber blades means faster limb movements, and less work to accelerate the limb. Second, the significantly higher energy return from the carbon fiber blades means less energy needed as the investment.
Now, BOTH of these theories predict the same thing - a reduced metabolic cost of sprinting, and a performance advantage. The problem was, back then, there was no research.
- Then the research came along and it confirmed the theory. It showed: 1) Pistorius used 25% less oxygen during sprinting, and 17% less oxygen during slow running than other sprinters. 2) His mechanics were very different to those measured in able-bodied runners, and suggesting less work required to run at a given speed. These were enormous differences, making him statistically way off the charts. They also implied advantage, because oxygen use is a barometer for metabolic energy cost. Herr and the team that tested him eventually resorted to comparing Pistorius to elite distance runners, and then he started to look similar, but it is remarkable that was still more economical than distance runners.
- Then came the explanation - Peter Weyand showed how Pistorius' running mechanics were off the charts. His ability to reposition the limbs was 4 SD faster than average, and a full 11% faster than the next fastest runner ever measured. This advantage means more contact time, and also reduces the need to generate forces. The result is that he has to produce half the muscle work compared to able-bodied runners.
So, in a nutshell, you had a theory, confirmed by the findings on physiology and metabolism, and then explained by the findings of his running mechanics.
All told, that's a compelling and almost complete picture. But the question is, what does it do to performance? Obviously, it's impossible to know with certainty. Weyand tried to quantify it, but as I explained in the previous post, I think he made some excessively "liberal" assumptions about how to adjust Pistorius' values. The result was an over-estimate. But I still believe it's possible to narrow down how large the advantage may be, and that's what I want to do in this post.
I'm going to go through this very slowly, systematically, but bear with me - past experience has taught that this pacing concept is tricky to explain, there are lots of gaps to fill!
The theory - an abnormal performance relative to other performances
And we begin again with a hypothesis: Pistorius' reduced metabolic cost of sprinting and those mechanical advantages lead you to the theory that Pistorius will be able to sustain a higher relative speed over longer distances than able-bodied controls. The advantage, in other words, will be seen if Pistorius is able to slow down less as he moves up in distance. I hope that is clear? He will run at a higher speed (relative to his OWN performances) than any other athlete, and that will reveal that the metabolic and mechanical factors we've explained are
Why would this be the case? To understand this, ask yourself the following question: Why don't 400m sprinters run faster in a 400m race? The reason this seemingly obvious question is important is because it's clear that every 400m runner COULD run faster, based on their performance over 200m, and the question is why don't they?

Take Michael Johnson, for example. Over 400m, he ran 43.18 seconds, and in that race, his first half was run in 21.22 seconds and the second half in 21.96 seconds (Ferro et al). His 200m PB, as you know, is 19.32s.
That means that his first 200m is 9.8% SLOWER than his best 200m, and his second 200m is 13.7% slower than his best 200m. Even if his 200m best is adjusted slightly because he wasn't quite in that shape at the time, he's still about 7% and 11% slower over 200m splits in a 400m than in a 200m race (bear with me as I try to evolve the argument - I have to labour the point because people may misunderstand this concept otherwise). I've shown this in the graph to the right.
Why pace a 400m race? And doing the impossible
So, it's quite clear that the 400m event is paced. This is obvious, but it's important to understand WHY it has to happen. The reason the race must be paced is because there is a significant metabolic cost to sprinting at 200m pace. If a runner does this, then factors such as metabolite accumulation (think H+ ions, phosphates, ADP) and failure to provide energy rapidly enough will force them to slow down too much. Start too fast, try to run a 400m race at your 200m pace, and you will pay for it big time and slow down in a big way in the latter part of the race. As it is, every single 400m runner in history has run the first 200m faster than the second 200m in a major race. It's just not possible to negative split and still run fast
What is impossible to do is to race a 400m race at anything close to your 200m pace. Rather, you pace yourself and still slow down in the second half of the race. Below is a graph showing that in elite 400m running, the only way to race is to run the first half between 2% and 6% faster than the second half. This happens without exception - 16 athletes in an IAAF final, every one did it. It even applies to the 100m segments - the slowest 100m segment in 16 out of 16 elite races is the final 100m, and by a long way.

The average breakdown in both men's and women's races is that the first half is 47.7% of the race, the second half is 52.3%. So, if someone is running a 45 second 400m, then the typical way of putting it together is to run the first half in 21.46s and the second half in 23.54s.
And before you say that not every athlete has to be "typical", look again at the graph above - Michael Johnson is the only "non-typical" athlete, because his split is 49%-51%. Even he, the outlier, is 1.7% faster in the first half, and that's about the limit for what is possible in terms of pacing a 400m race "evenly". But as I mentioned, he still runs the first half a full 10% slower than his best and the second half 14% slower than his best (see the top graph)
I must just make the point, that it's possible to run the second half faster than the first, but then you'd have a huge overall under-performance. Michael Johnson could run the first half in 25 seconds and then blast a 20.5 second second half, but the time he'd produce is not optimal. And that's key.
Now, what's the significance of this? It's very significant, because once you understand this concept, you realize that this method of looking at how a race is constructed is a very important and meaningful way of understanding Pistorius' performances.
There are three things to consider:
- This method allows you to compare the first 200m of a 400m race to a 200m time. This deals with the start issue, because both races include the start. So you can see how he paces himself relative to a valid and reliable anchor - his own performance.
- The method also allows comparison of the second 200m to the best 200m, which gives an indication of fatigue over the course of a race. Importantly, here the 200m race has the start, whereas the second 200 of a 400m race doesn't, and that makes the difference even greater. When Michael Johnson is running a 21.96 s second half, it's a) much, much faster than anyone else has run, and b) it's still a full 14% slower than his 200 and would be even larger if you accounted for the start.
- You can also compare the halves of a 400m race, first to second 200m. That is significant because it's known that the 48%-52% is pretty much universal. However, in Oscar Pistorius' case, this comparison is not meaningful because of his affected start.
This is important, because one can be misled if you just look at his first and second halves, because we don't know the time loss at the start. I've heard Pistorius say it's 2 seconds, which is ridiculous, because he runs 100m in 10.9s, and so if he's losing 2 seconds, he's basically saying that he'd be a 8.9 second 100m runner without it. So moving on from that...
The point remains that Pistorius has an affected start, and that's why the first and second points above, where you compare his 200m race to his 200m splits gives you value AND accounts for any differences in the start
The key requisite is that the runner must have valid 200m and 400m times, and I'm happy to concede this point in this illustration. Many 400m runners race over 200m early in the season as part of their speed training, but that's different from recording a 200m in a targeted competition. So the comparison will only work when the runner is racing 200m and 400m in targeted races, like Johnson, Felix, Perec and Richards-Ross did. The issue is one of "capacity". It does get trickier when you look at the 400m specialists (as opposed to the "double runners") who dip down only occasionally. Then there is the variability in performance - these are not robots, and there is variability in performance that means you never really compare like to like. Again, I concede this point, but this is why this illustration is not "proof", but comes at the end, almost an addendum to the three posts I've done on the science of Pistorius. There will be disagreement, and that's fine, this is not proof, only an extension of previous explanations.
So I hope it's clear what the approach is - it's to compare an athlete over 200m and 400m, but not simply to look at times (which is what a lot of people missed in the tweet. Fair enough, it's only 140 characters!)
So I hope it's clear what the approach is - it's to compare an athlete over 200m and 400m, but not simply to look at times (which is what a lot of people missed in the tweet. Fair enough, it's only 140 characters!)
The key is to look at how the race is constructed relative to that athlete's 200m race.
Oscar Pistorius - an increasing advantage as distance increases
So let's start with the simplest illustration, and then get increasingly more advanced. The simplest thing is to take Pistorius over 200m and find similar performances in other athletes.
Pistorius' best 200m is 21.41s. There are no male 400m runners with a 200m best as slow, so the best comparison comes from women runners. Allyson Felix has a PB of 21.81, and she's a great comparison because she's also focused on 400m events, like Pistorius (who races 200m seriously at the Paralympic level - it's important that the runner has to be competitive over both distances). Then you can take Mari-Jose Perec, another 200m-400m combination runner. Her 200m PB was 21.99s. And Sanya Richards-Ross, a current 400m star, and her 200m PB is 22.17s.
So these three athletes are close to Pistorius - about 0.4 to 0.8 seconds slower than him over 400m. But what about at 400m? The image below summarizes the differences at the 200m and 400m distances:

So, those small differences over 200m, which you'd expect to be more or less doubled over 400m are suddenly much, much larger. The Felix comparison is especially obvious - 0.4 seconds apart over 200m, and 4.6 seconds over 400m. That is partly the result of Felix perhaps still underperforming over 400m, but you can't say the same about Perec, or Richards-Ross. Their better performances are over 400m, and they too have a huge deficit at 400m, but not 200m.
That's telling to begin with. But, it's not a definitive point - you can counter this by saying that Pistorius loses maybe 0.5 seconds at the start. And you'd be right - that accounts for maybe 0.5 seconds of the difference, but not all three to four seconds. You could argue that Pistorius' 200m would come down, maybe to 21 seconds. Fair enough, that accounts for 0.5 seconds, but not all three. My point is that the differences are just so large that they are compelling. (You can do the same for men's runners, but in reverse. Find other 45 second guys, and you will find that all of them are more than 1 second faster than Pistorius over 200m, assuming they run 200m often enough to have decent times there, like Pistorius does)
Pistorius - putting the race together, racing 400m at close to 200m pace
But the picture crystalizes when you look at pacing and how the race is put together.
 I've already showed Michael Johnson's performance - a 43.18s which was made up of a 21.22 and a 21.96s. To the left is a figure showing the performance of each half compared to MJ's best, as well as a "conservative" assumption that he might have "only" run 19.8s in 1999.
So, 9.8% slower for the first half, 13.7% slower for the second half. To repeat, the reason this has to happen is because the starting pace must be conservative to allow for distance, while the second half is slow because of a combination of pacing and fatigue. Even if you make the adjustment, the pace is still 7.2% and 10.9% slower, first and second half, respectively.
And remember, Michael Johnson is the exception to the rule - in most situations, you'll see an even larger difference than you see in this figure.
Perhaps you're dismissing Michael Johnson because he's such a great 200m runner, one of the greatest ever. I'd argue that he's the greatest 400m runner ever, so his 400m to 200m comparison is, I believe,valid to compare to Pistorius. But let's look at a few other runners.
First, back to the women - Felix, Perec and Richards-Ross. Here, we don't have split data for their 400m PBs. So, it needs an assumption. And in in the interests of making the "conservative" assumption, we assume that their race is 48-52 split (remember that above, I showed that the average for women is 47.6%-52.4%, so this assumption is valid. The graph below shows their projected splits, relative to their 200m bests.

So Allyson Felix, who I think is the best comparison by virtue of the fact that she's the 200m runner going up and still improving over 400m like Pistorius, runs the first half at a similar relative speed to Johnson (9.4% vs 9.8% compared to 200m times), but then her second half is very slow relative to her best. Perec and Richards-Ross, slightly different runners in the sense that they were 400m runners going down in distance, start and finish closer to their 400m speed, but it's still a big gap - 5.5% on the first half, 14% on the second half. Remember that their 200m PBs may be under-performances, much like Pistorius' may be this season. But these are typical race patterns, relative to the 200m races.
Remember also that if you want to change the assumption of pacing from say 48-52% to 49-51%, and make them run faster in the second half, then you'll find bigger gaps in the first half of the race, relative to the 200m PB. This is the strength of comparing to 200m PBs - the assumption over pacing and the split is actually not that crucial. All it affects is the relative size of the difference between first and second halves. The "weakness",which I freely admit, is that it uses 200m times, and assumes that they're max performances. For Perec and Richards-Ross, I dare say they are not, and that they would be even faster over 200m. Which of course increases the percent differences you see in the figure above.
Remember also that if you want to change the assumption of pacing from say 48-52% to 49-51%, and make them run faster in the second half, then you'll find bigger gaps in the first half of the race, relative to the 200m PB. This is the strength of comparing to 200m PBs - the assumption over pacing and the split is actually not that crucial. All it affects is the relative size of the difference between first and second halves. The "weakness",which I freely admit, is that it uses 200m times, and assumes that they're max performances. For Perec and Richards-Ross, I dare say they are not, and that they would be even faster over 200m. Which of course increases the percent differences you see in the figure above.
Pistorius case
So let's now look at Pistorius. The first issue is to ask what his splits would be? We don't have his splits from the 45.07s race, but from all reports, that bizarre negative split strategy that he used in Rome in 2007 has now been replaced by a more optimal one. The fact that he could run a 46.78s with a negative split and a second half of 22.72s tells a story of its own, of a runner who doesn't fatigue normally, but for this discussion, that race is not relevant, because it is four years old and he's improved by seconds since.
So there are a few options. One way to do it is to give him the "typical" race allocation of 47.8%-52.2%. I've shown that on the far left in the figure below. The problem is, Pistorius loses time at the start, and so his breakdown is likely to be more even. So then we might make his race similar to Johnson's a 49%-51% split (the 'outlier' by comparison to other 400m races, as you saw in the figure above), and you see the figure in the middle is the result. This would be the case, by the way, if Pistorius loses 0.5 seconds at the start.
And then a final option, just to make the point, is to assume that Pistorius does a 400m race with a 50%-50% split. That is shown on the far right. The reality is that this pattern would be highly, highly unusual, even given a slow start. Remember, the normal pattern, the universal pattern, is that the second half is 2 seconds slower than the first half. Even a full second lost at the start would not produce this pacing strategy. Here, we've made every assumption possible IN FAVOUR of Pistorius, and the figures below are the result
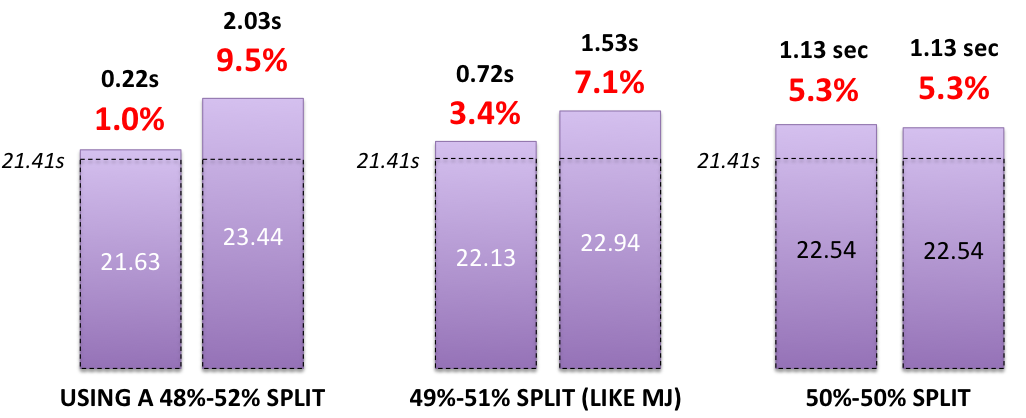

So, the average, across able-bodied runners, is to run the first 200m 7.5% slower than the best 200m, and to run the second 200m 15.2% slower than the best 200m. Pistorius runs both halves significantly faster than this, to the tune of anything between 2% and 6% faster for the first half, and 6% to 10% faster than the second half, depending on what the pacing strategy you assume.
Take the 50-50 split example (bottom right graph). Here, Pistorius runs the first half 5.3% slower than his 200m PB, which is the same as Perec and Richards-Ross. However, then the second 200m is remarkably different - 5.3% compared to more than 14%, a 9% difference. This the value of segmenting the race. If you go with the typical strategy, then he is 4.2% faster and 8% faster than able bodied runners for the first and second halves, respectively.
Now, I realize there are assumptions here, but I hope that I've covered the range of possible inputs, and illustrated that if you assume a slow start, then the implication is a faster finish (both in time and relative to the 200m PB anchor), and in both instances, he stands out because of his performance over 400m segments relative to his 200m. I would put the net size of that advantage between 3% and 8%, or around 3 to 4 seconds in a 400m race. I dare suggest that if Weyand were to adjust his estimate based on the points I made in the previous post, he'd produce a similar number.
Some of you may be thinking that his 200m is a huge under-performance, explaining these findings. I disagree - that PB of 21.41 is only a year old, and so it may certainly be up for revision, but only slightly. You might improve it by half a second (based on the 400m improvement seen - it may not change at all, of course), and I'd invite you to look at what that does to the performance comparison.
In fact, there's only one way to make assumptions that don't give Pistorius an advantage - you have to assume that his 200m PB drops to 20.20 (a full 1.2s faster). Possible? Sure. But overall, there are perhaps 10 assumptions you'd have to make, and the only way to NOT show an advantage is to make 10 out of 10 in one direction. And yes, there are ranges (that's why Usain Bolt who is fastest over 200m is not guaranteed to win over 400m - he'd slow down more than others), but even with the ranges, you see an outlier.
All told, what is the conclusion? The conclusion is that Oscar Pistorius runs a 400m race at a speed that is much, much more like his 200m race pace than any other 200m-400m runner in history. Why might this be? Remember the big picture - you have a theory, you have evidence, and you have a mechanism. All these factors suggest that Pistorius sprints at a lower metabolic cost, with less work required, and therefore, the implication is that as distance increases, his pace declines less than for other athletes.
The key to this debate is by no means this observation. The key is the evidence gathered, which I've explained in the previous three posts. I post this because it's a compelling observation that lends further support to the theory.
Now, let's go onto the athletics and leave this issue behind!
Ross
Appendix: Performance analysis - key to make the prudent assumptions
I foresee some comments about the idea about making assumptions. It was the same when I tried to explain how performance analysis can help identify and explain possible doping behaviour. So the first response is to emphasize that I'm not making these assumptions to PROVE a point, but rather to add to an already existing set of findings. The evidence is there already. I do the post above because it gives context to the evidence, a practical illustration of what the evidence suggests might be the case. To me, it adds another "brick in the wall" in the issue of Pistorius' advantage, but it's not proof, and please recognize this before labeling as absurd any of the estimates.
But more than this, I'm a big believer in performance analysis, as regular readers will know. I believe that if you are SENSIBLE about how you analyze performance, you can glean enormous quantities of useful information.
The key is that you have to be prudent about what you assume. Before dismissing an illustration based on assumption as flawed, just remember that assumption is often valuable in evaluating options. For example, in business, you always develop business cases based on assumption before making business decisions. You make a "best case" and "worst case" scenario, and if the "worst case scenario" still succeeds, then the business will likely succeed. I used to do this all the time when I worked in sports business because for example you have work out if a sports event is viable. So you assume how many tickets you'll sell, what the costs of staging the event are, and so on. If you make all the worst assumptions, and succeed, then the event works. And that's the principle here - reasonable assumptions show what is feasible and what is not.
In the Pistorius debate, Peter Weyand tried to quantify the size of Pistorius' advantage by adjusting his mechanical advantages and making them equal to those of able-bodied athletes. The result was his estimate of a 12 seconds advantage, which is probably an over-estimate.
But the point I made the other day is that it was the assumptions that may be incorrect, not the principle, and the same goes for any performance analysis. So above, I have tried to make the equivalent of "worst case" scenarios. Don't just make Pistorius equal to the "typical" case, because clearly he is not. Rather make him the outlier and see what happens then. So don't give him the 47.8%-52.2% split which is typical, show the 49%-51% and the 50-50 splits as well. Reduce the 200m time to see how it affects the pace. And when those are all done, then you start to see the picture.
There are perhaps 10 assumptions you can make - if you make all 10 in the "favourable" direction, then you find that Pistorius is getting an advantage of around 15 to 18% (7 to 8 seconds in a 400m). If you make all 10 in the "unfavourable" direction, then you can estimate the advantage at around 3 to 4% (about 2 seconds). The reality is that it's likely to be a moderate version. But the advantage is still there.
![]()


0 Comments:
Post a Comment